
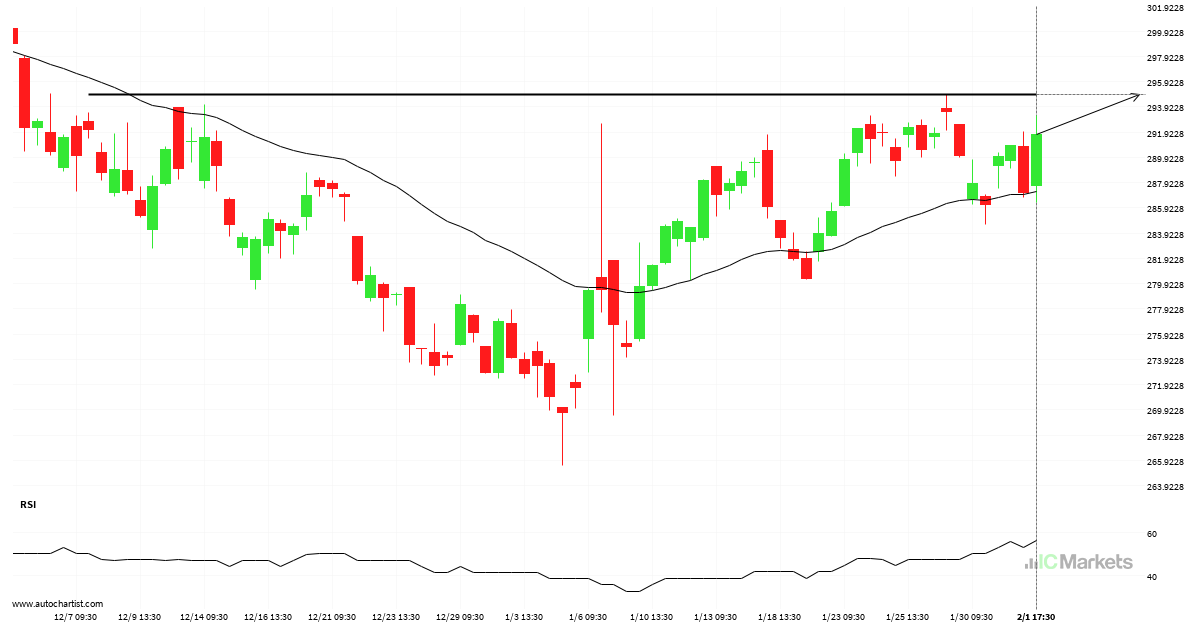
Breach of important price line imminent by Biogen Idec Inc
Biogen Idec Inc is moving towards a line of 294.8700 which it has tested numerous times in the past. We have seen it retrace from this position in the past, so at this stage it isn’t clear whether it will breach this price or rebound as it did before. If Biogen Idec Inc continues in […]
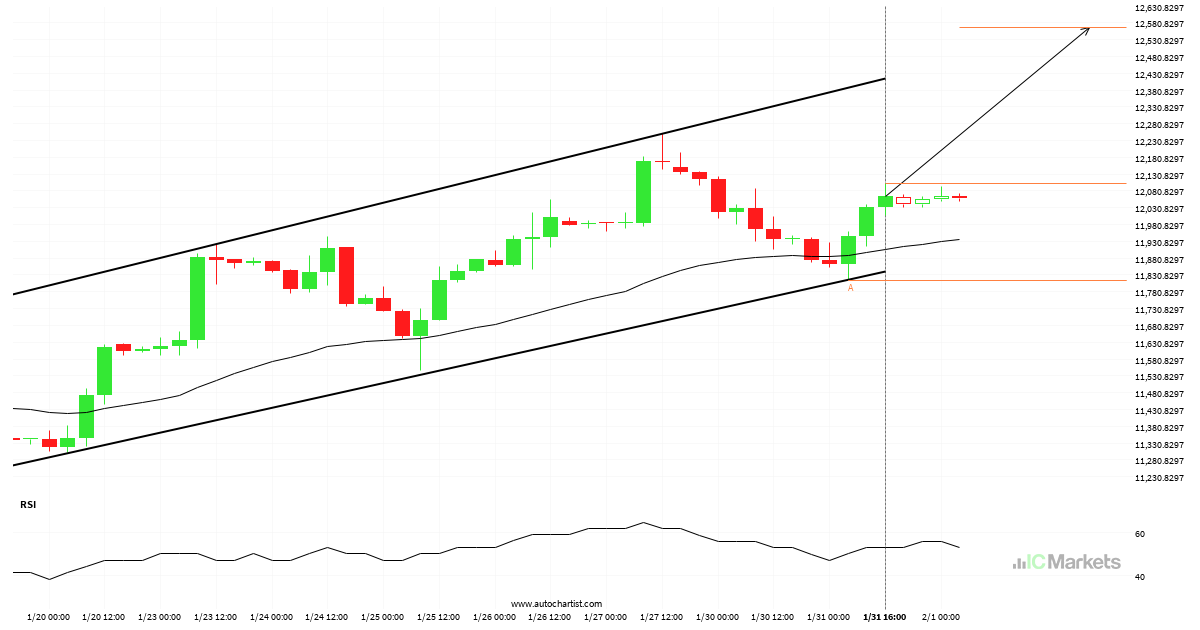
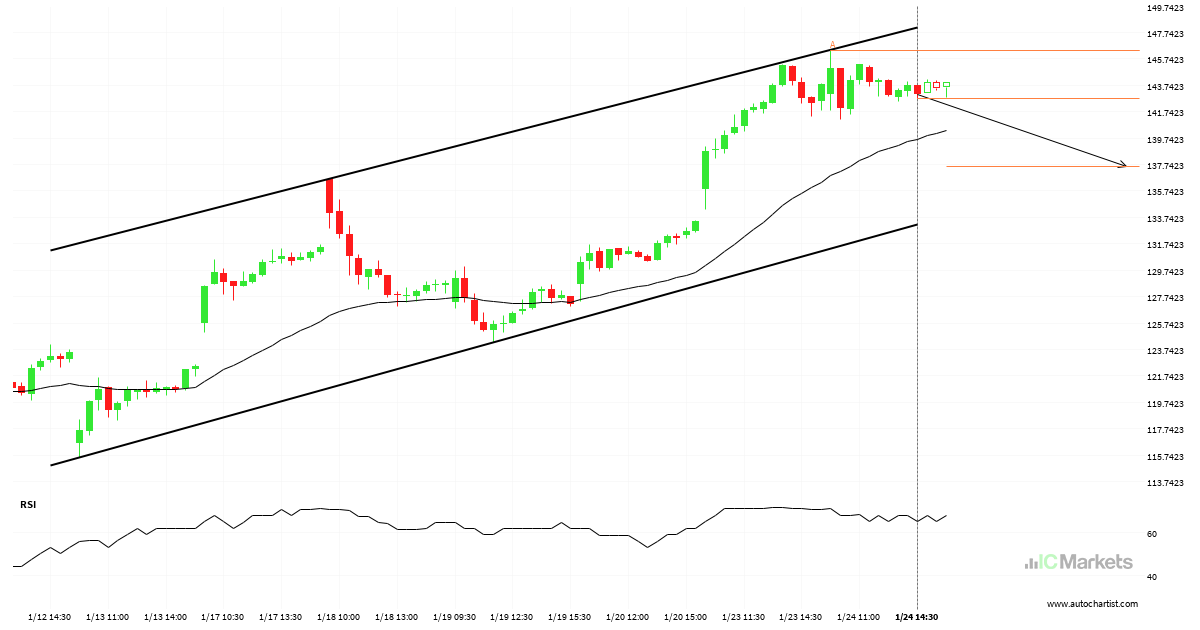
US Tech 100 Index – getting close to resistance of a Canal ascendente
US Tech 100 Index is moving towards a resistance line. Because we have seen it retrace from this line before, we could see either a break through this line, or a rebound back to current levels. It has touched this line numerous times in the last 14 days and may test it again within the […]
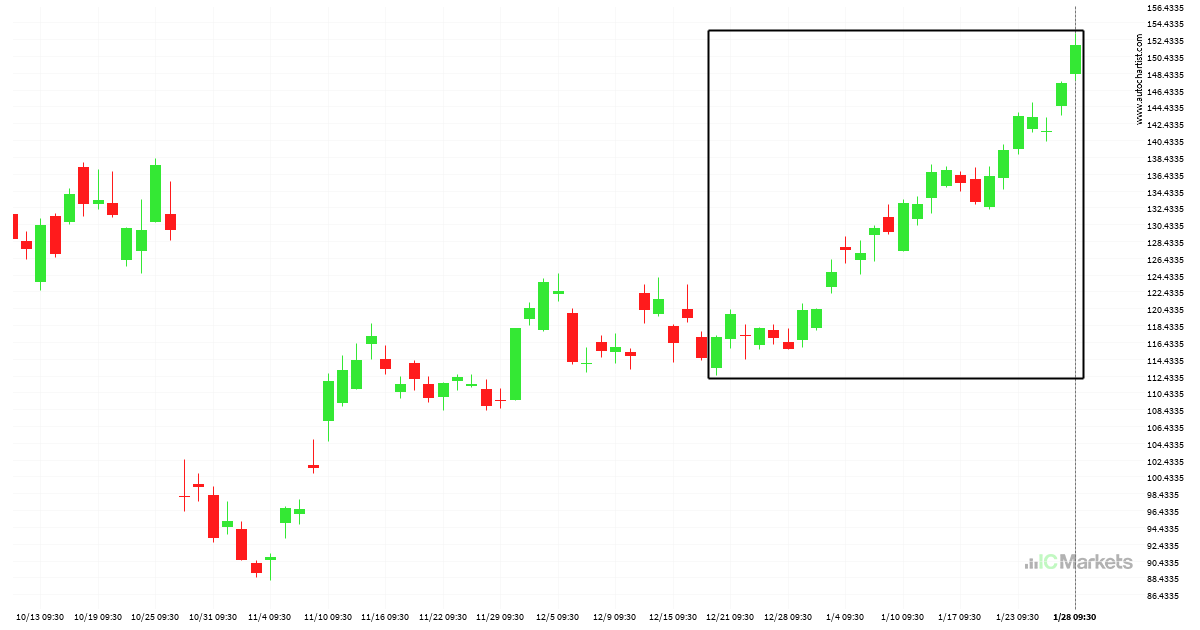
Meta Platforms, Inc. – Class A Common Stock experienced an exceptionally large movement
For those of you that don’t believe in trends, this may be an opportunity to take advantage of an exceptional 29,58% move on Meta Platforms, Inc. – Class A Common Stock. The movement has happened over the last 40 days. For those trend followers among you, you may think about riding this possible trend.
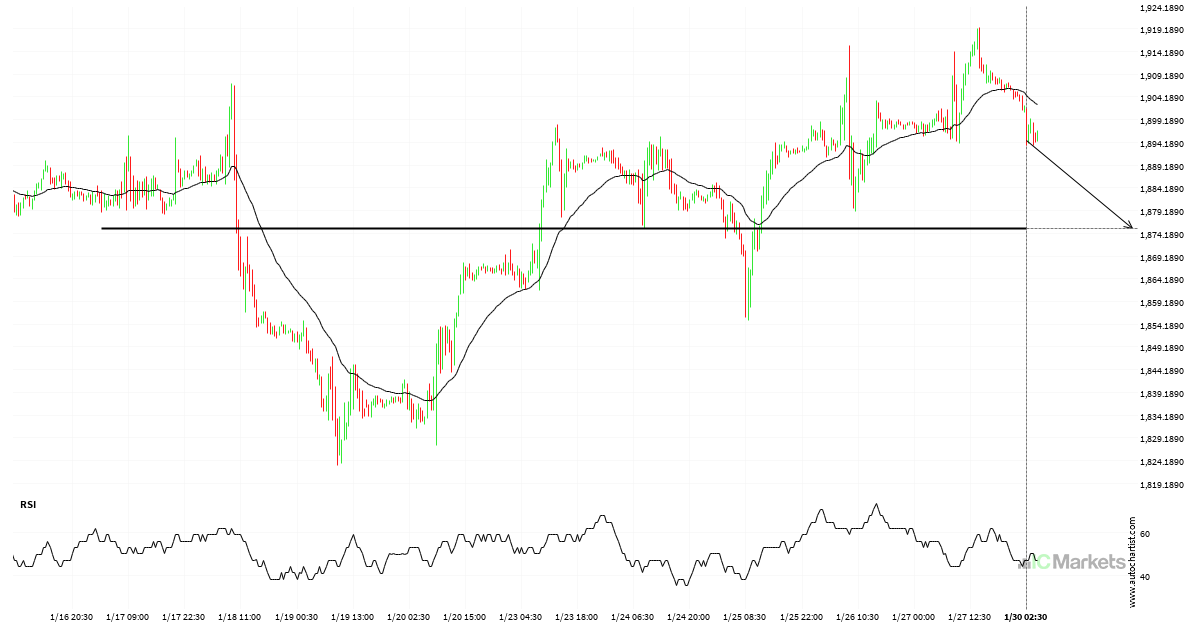
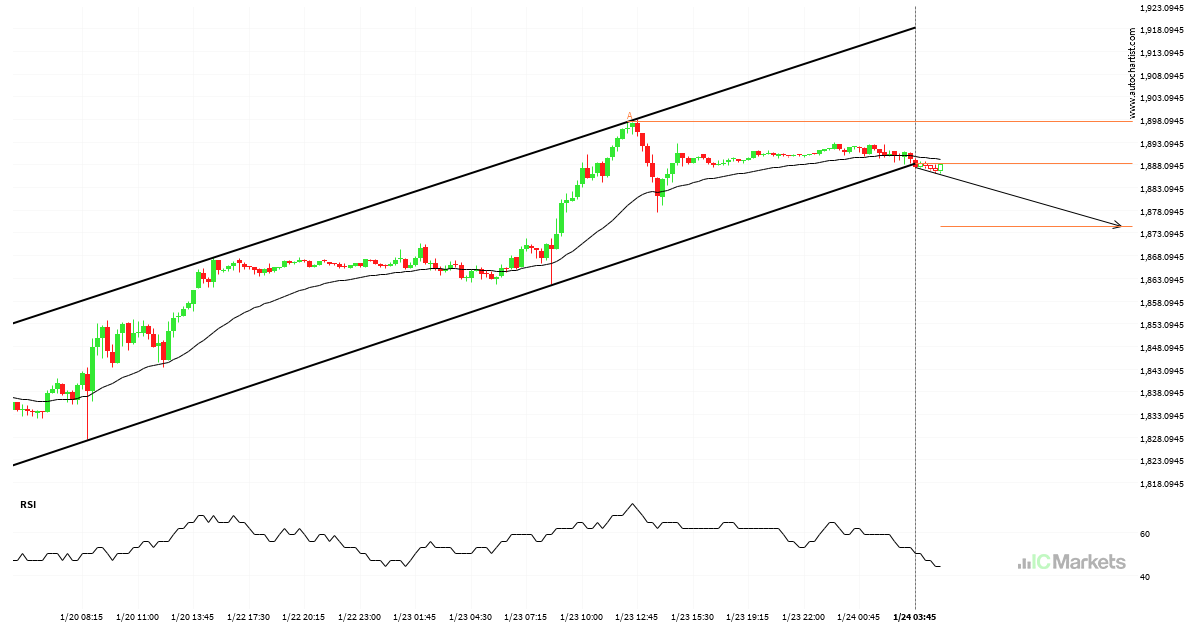
Either a rebound or a breakout imminent on US Small Cap 2000 Index
US Small Cap 2000 Index is heading towards a line of 1875.2800. If this movement continues, the price of US Small Cap 2000 Index could test 1875.2800 within the next 3 days. But don’t be so quick to trade, it has tested this line numerous times in the past, so this movement could be short-lived […]
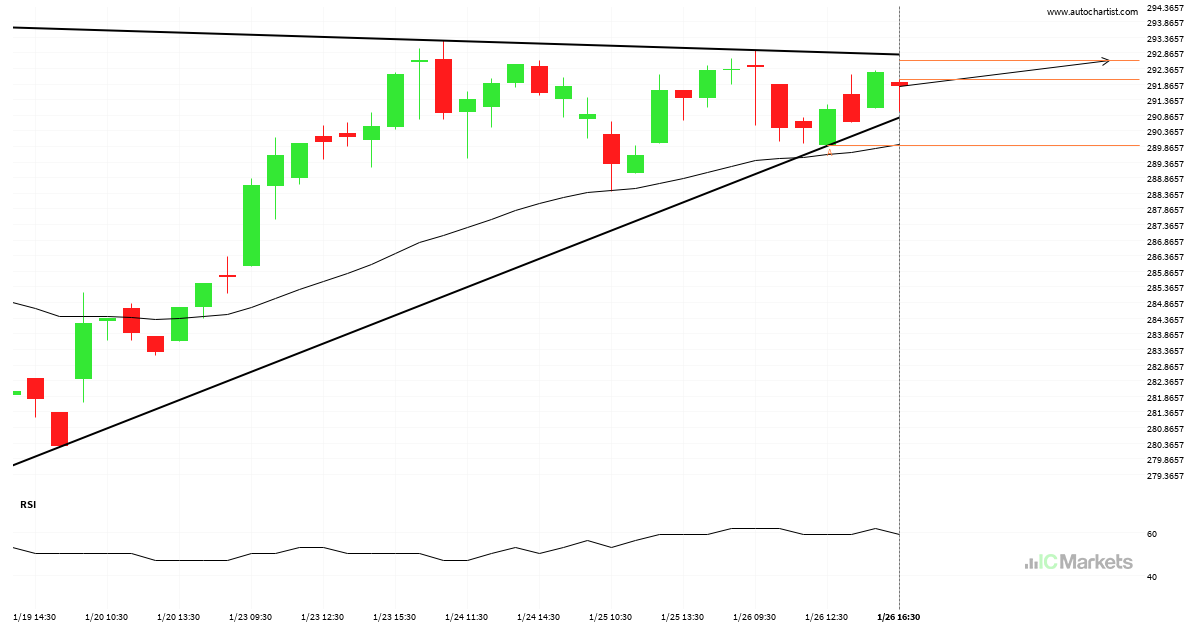
Will Biogen Idec Inc have enough momentum to break resistance?
Biogen Idec Inc is heading towards the resistance line of a Triângulo Ascendente and could reach this point within the next 11 hours. It has tested this line numerous times in the past, and this time could be no different from the past, ending in a rebound instead of a breakout. If the breakout doesn’t […]
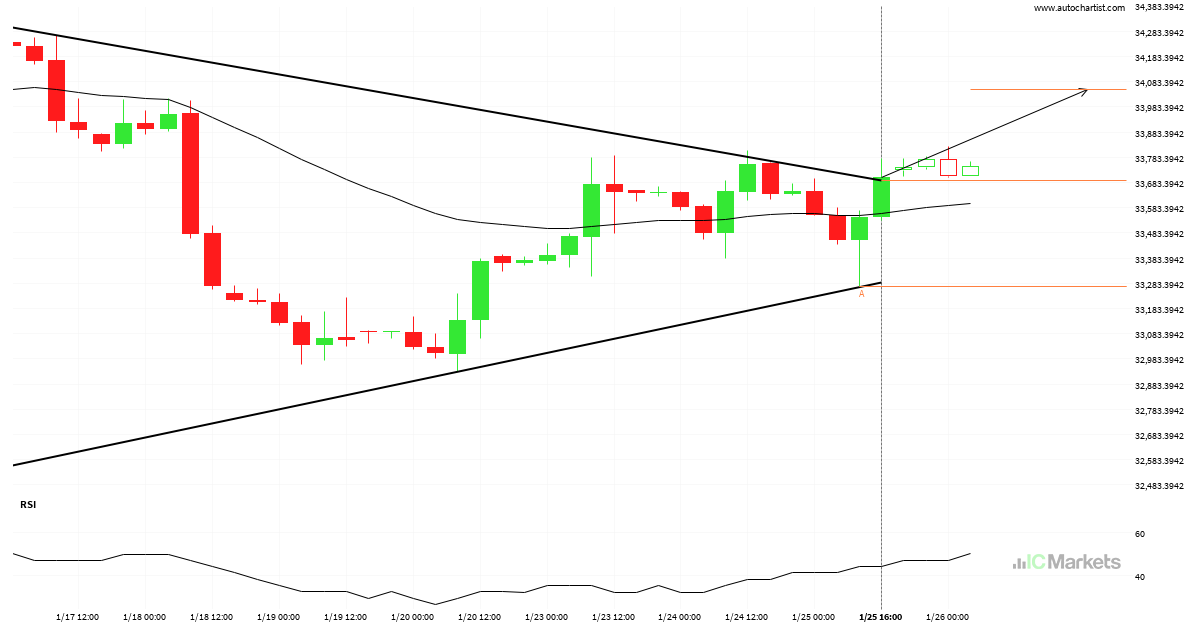
US Wall Street 30 Index has broken through resistance
US Wall Street 30 Index has broken through a resistance line. It has touched this line at least twice in the last 16 days. This breakout may indicate a potential move to 34050.9112 within the next 2 days. Because we have seen it retrace from this position in the past, one should wait for confirmation […]
Possible breach of support level by Tesla Inc.
Tesla Inc. is moving towards a support line which it has tested numerous times in the past. We have seen it retrace from this line before, so at this stage it isn’t clear whether it will breach this line or rebound as it did before. If Tesla Inc. continues in its current trajectory, we could […]
Support line breached by US Small Cap 2000 Index
US Small Cap 2000 Index has broken through the support line which it has tested twice in the past. We have seen it retrace from this line before, so one should wait for confirmation of the breakout before trading. If this new trend persists, a target level of around 1874.4553 may materialize within the next […]
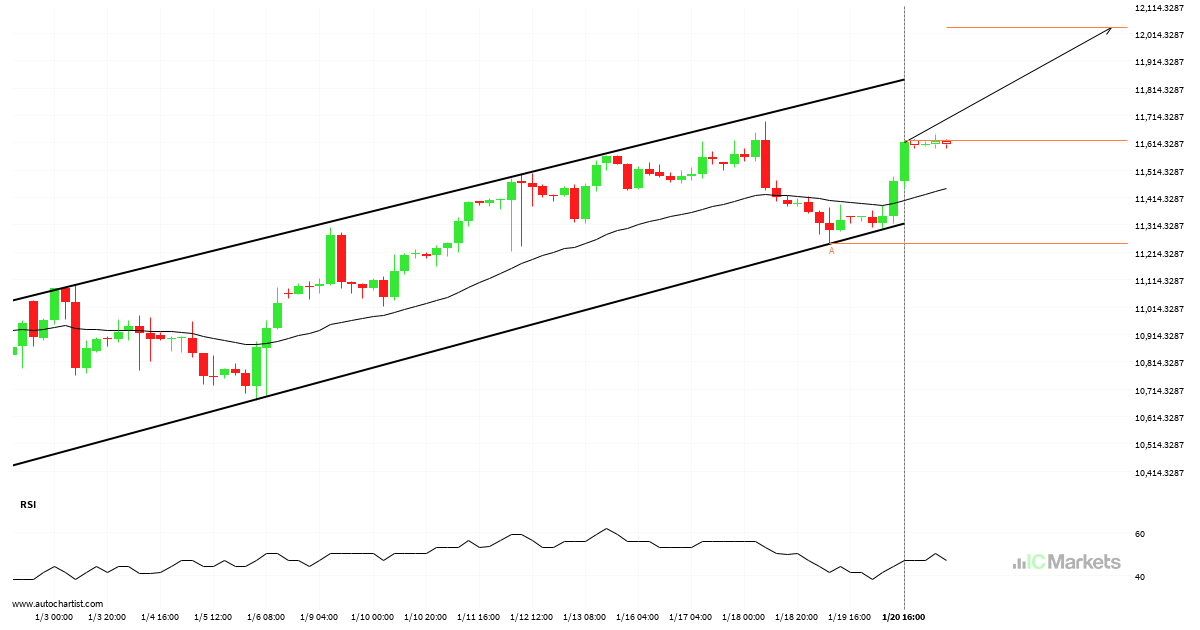
US Tech 100 Index – getting close to resistance of a Canal ascendente
US Tech 100 Index is moving towards a resistance line. Because we have seen it retrace from this line before, we could see either a break through this line, or a rebound back to current levels. It has touched this line numerous times in the last 24 days and may test it again within the […]
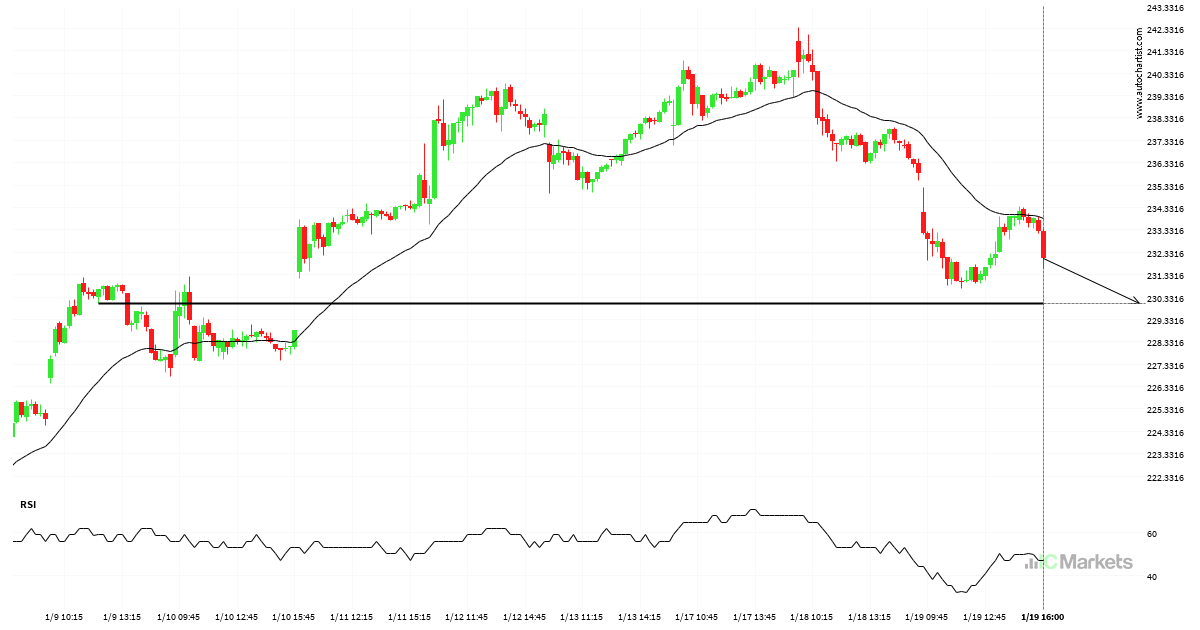
Either a rebound or a breakout imminent on Microsoft Corporation
Microsoft Corporation is heading towards a line of 230.0300. If this movement continues, the price of Microsoft Corporation could test 230.0300 within the next 12 hours. But don’t be so quick to trade, it has tested this line numerous times in the past, so this movement could be short-lived and end up rebounding.